


-
You are here:
- Baby's Days

- System Features ▼
- System Features P to P
Progress Statistics
Progress Statistics
Shown below is detailed information and a selection of screenshots taken from the Progress Statistics section from the English version of the Baby's Days system.
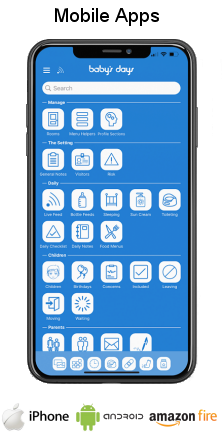
Available on the following system:
To view screenshots and information from other areas of the system, click on any link to the right.
Key Areas of the Progress Statistics section
The progress statistics are created automatically by graphically displaying achieved Early Years Outcomes for each child.
Statistics can be viewed on a per child basis or by area of learning for all children within a specific room.
Statistics can be viewed on a monthly, quarterly or yearly view for any time period.
All statistics graphs can be printed.
Screenshots and more Information
Shown below are a selection of screenshots and additional information relating to the Progress Statistics section on the system.
Statistics by Child Overview
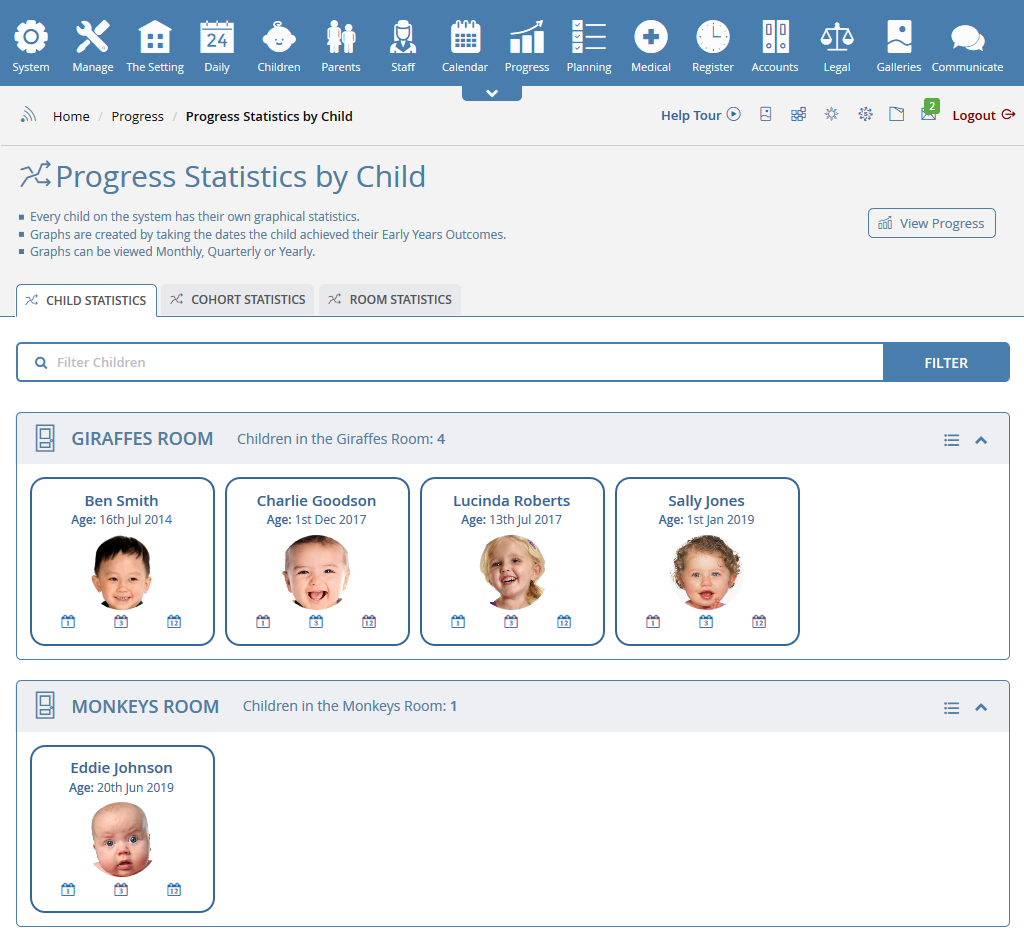
The Progress Statistics by child overview page allows you to select an individual child to view their achievements over a monthly, quarterly or yearly period.
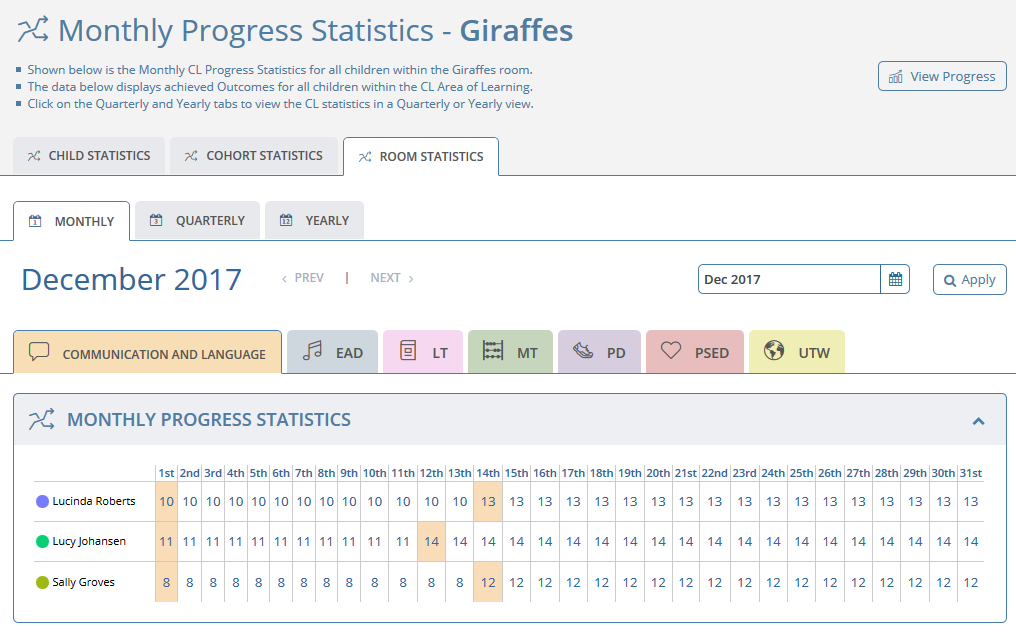
Monthly, Quarterly and Yearly Statistics by Child

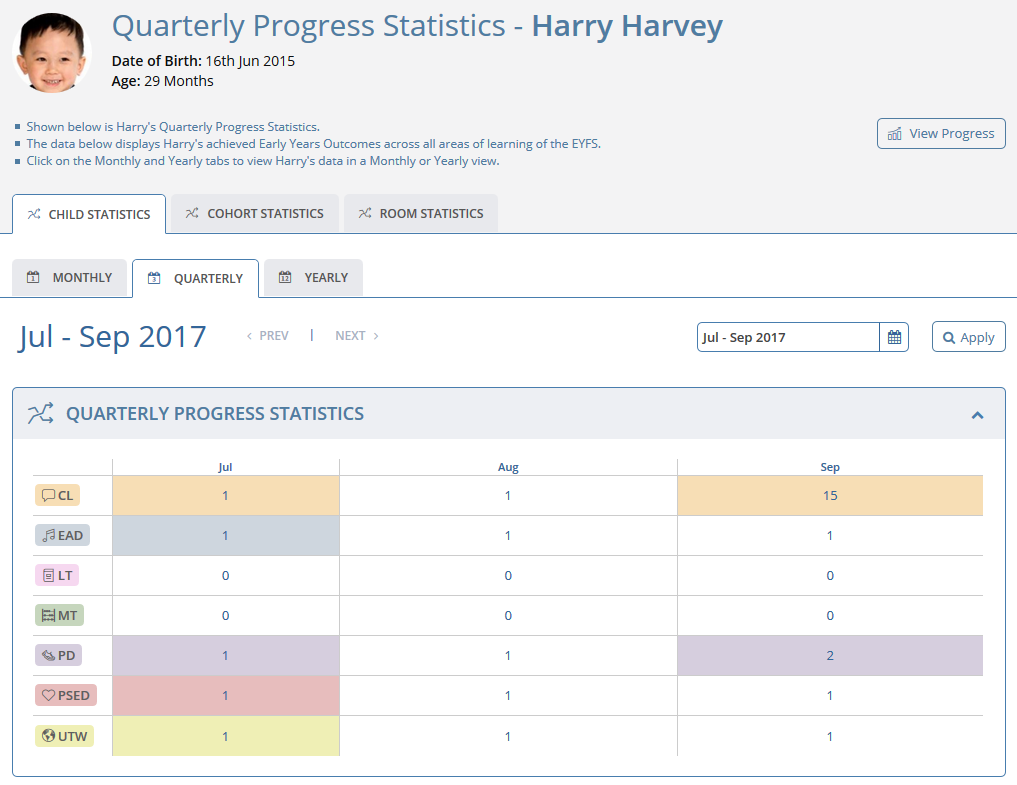

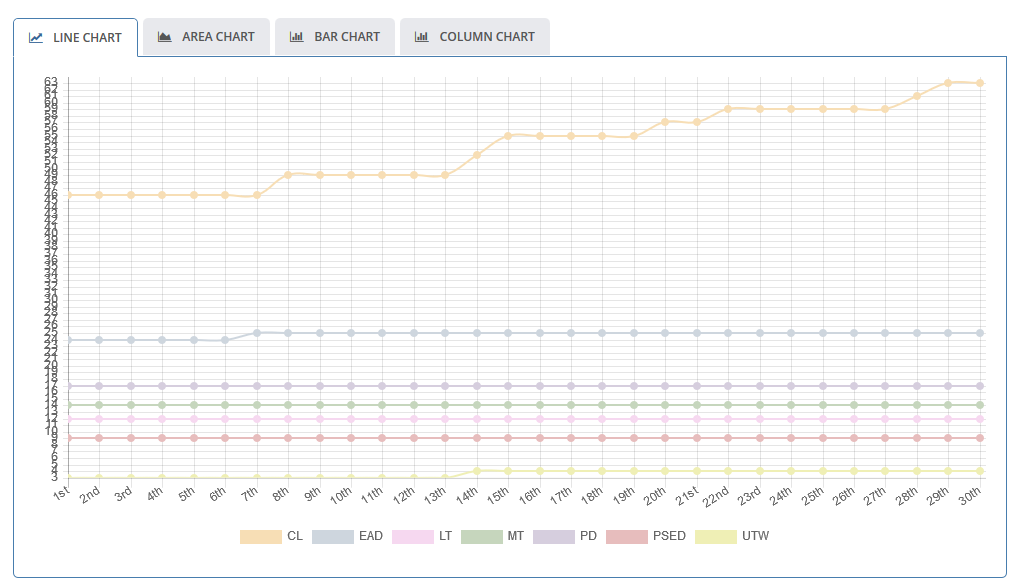
When viewing a child's statistics, all the Early Years Outcomes that they have achieved within each area of learning are clearly displayed at the top of the page, this data is automatically replicated within the graph below and any increase in quantity of achieved Early Years Outcomes is highlighted in the area of learning colour.
The statistics can be viewed by month, by quarter or by year.
You have the ability to print the statistics.
Each Area of Learning within the statistics can be shown / hidden allowing for easy comparison between them.
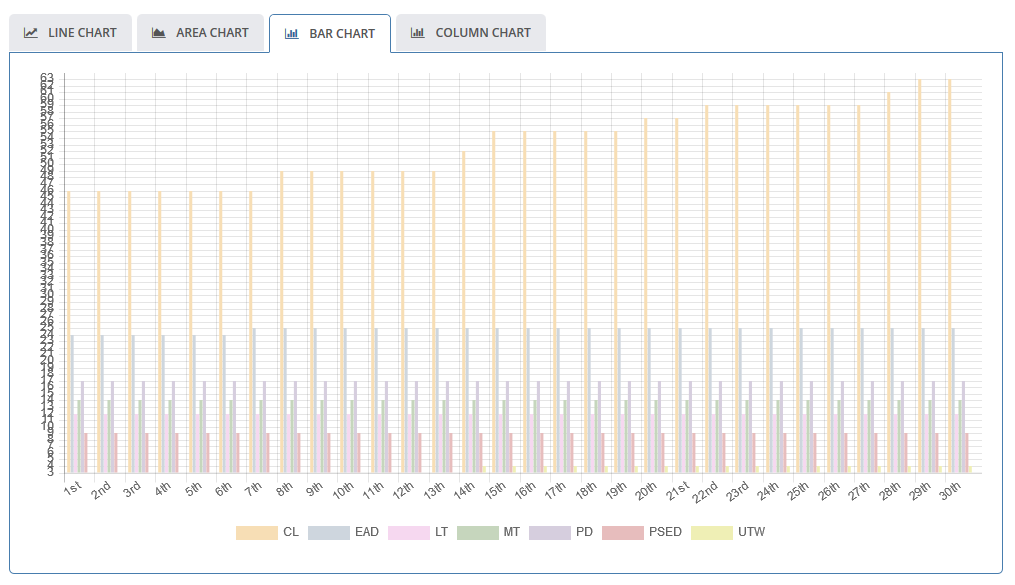
The statistics can be displayed in four different types of graph: Line Chart, Area Chart, Bar Chart and a Column Chart.
Statistics by Area of Learning Overview
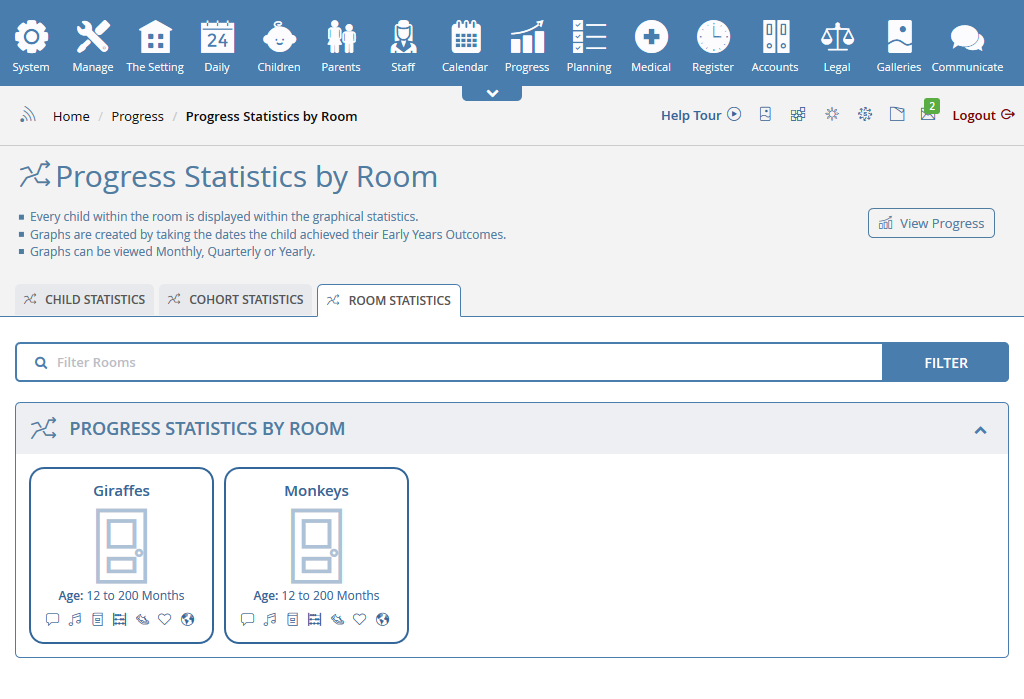
The Progress Statistics by area of learning overview page allows you to select an area of learning from the 2021 EYFS and see how each child within a specific room compares across each area.
Monthly, Quarterly and Yearly Statistics by Area of Learning
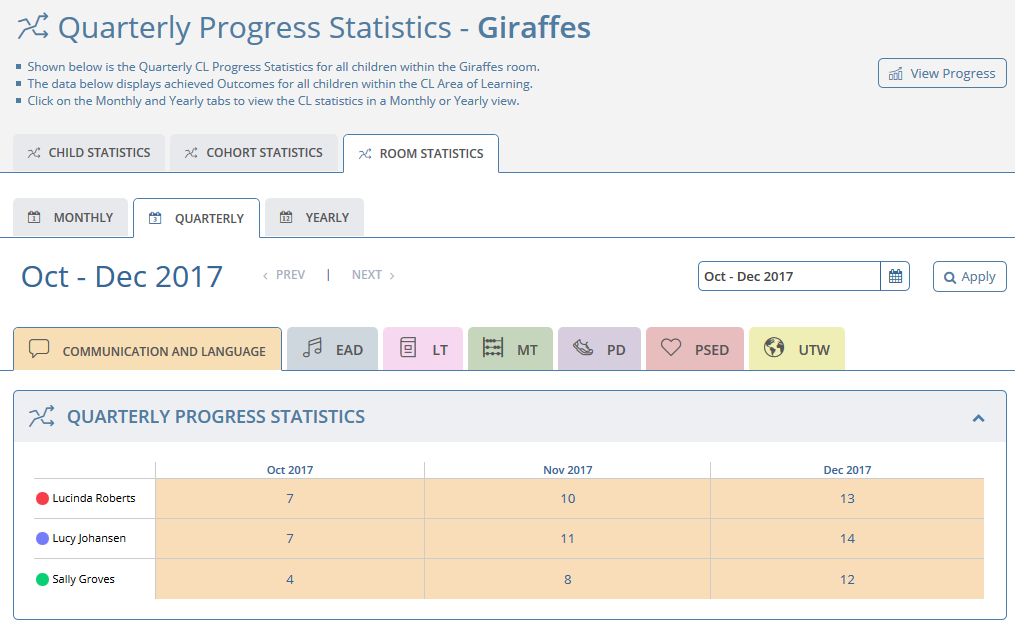
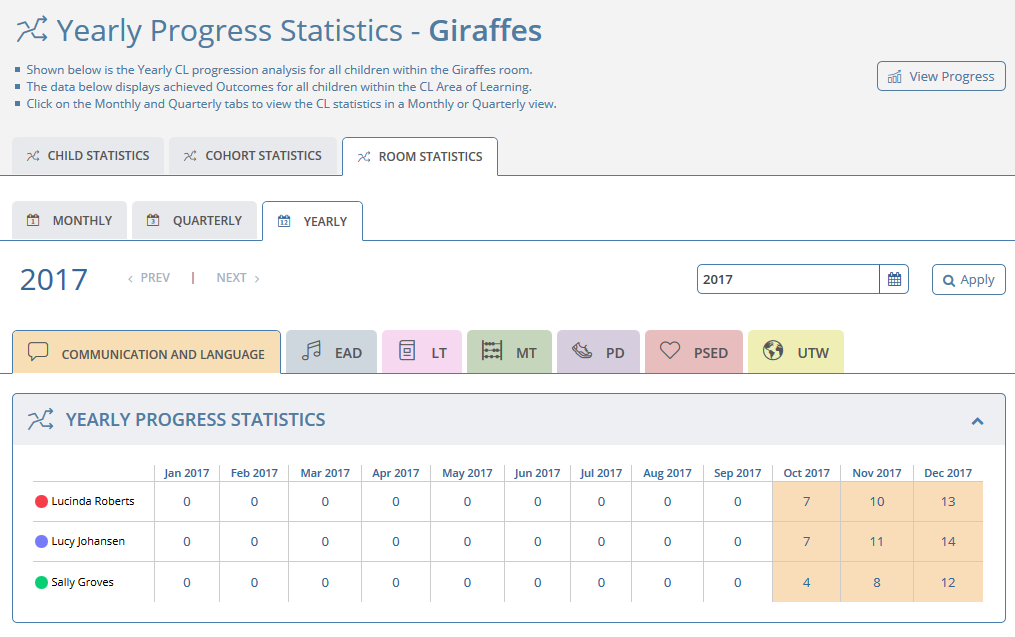
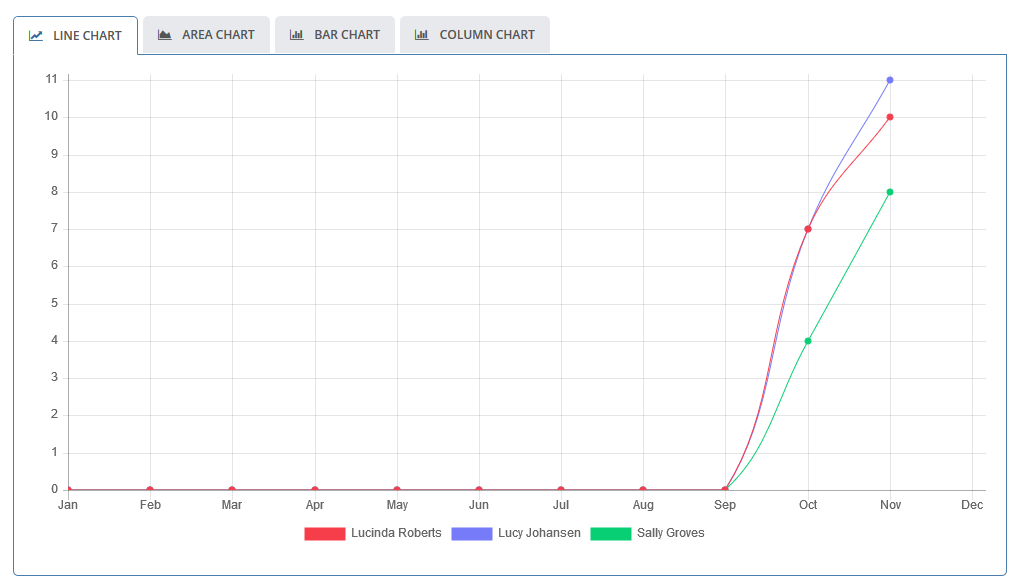
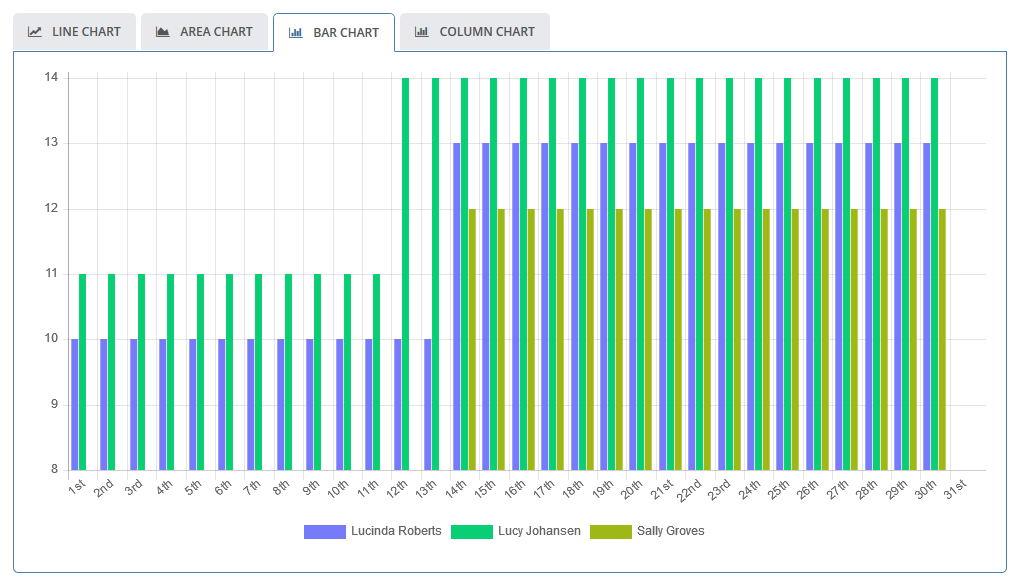
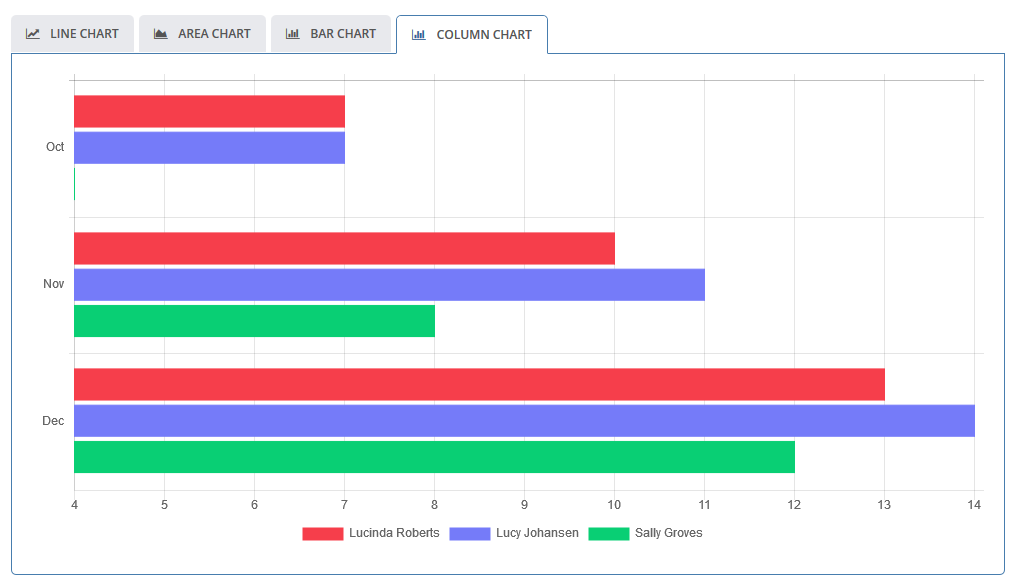
When viewing the statistics by area of learning, all the Early Years Outcomes that each child within the selected room have achieved within each area of learning are clearly displayed at the top of the page, this data is automatically replicated within the graph below, and any increase in quantity of achieved Early Years Outcomes is highlighted in the area of learning colour.
The statistics can be viewed by month, by quarter or by year.
Each Child within the statistics can be shown / hidden allowing for easy comparison between them.
The statistics can be displayed in four different types of graph: Line Chart, Area Chart, Bar Chart and a Column Chart.
 2 Year Check
 Accounts / Bookkeeping
 Achievement Search
 Administrators
 Assistant's Register
 Attendance Register
 Authorised Persons
 Birthdays
 Bottle Feeds
 Bulk Download
 Bulk Photographs
 Calendar
 Care Plans
 Children
 Children's Notes
 Colour Schemes
 Communicate
 Compliments and Complaints
 Concerns
 Contracts
 Control Centre
 CPD Log
 Daily Actions
 Daily Checklist
 Daily Diary
 Daily Notes
 Data Audit
 Document Upload
 EY Outcomes Search
 Evacuation List
 Fire Drills / Plans
 First Aid Boxes
 Food Menus
 Food Menu Helpers
 Import / Export
 Included Sections
 iSign
iSign Leaving Children
 Medical
 Next Steps - England
 Observations - England
 Occupancy Levels
 Parental Access
 Permissions
 Personalise
 Photograph Galleries
 Photograph Collage
 Planning - England
 Policies
 Progress / Learning
 Progress Statistics
 Questionnaires
 Quick Notes
 Risk Assessments
 Rooms
Rooms Room Move Children
 SEF - England
 Sleep Monitor
 Starting / Baseline
 Suncream Monitor
 Temperatures
 Termly Reports
 Toileting Monitor
 Vaccinations
 Video Galleries
 Visitor's Log
 Waiting List
 Wellbeing / Achievements


Follow Us


Click an icon below to see a system feature
With over 100 available features on every Baby's Days system, select one below that you'd like to read about first.


THE ONLY THING WE CAN'T DO IS DECIDE WHICH PACKAGE IS BEST FOR YOU